View by: sector | skills used
Nonprofit
healthcare • philanthropy • food security
Nonprofits and community organizations often lag behind when it comes to technical innovation, due to constraints of budget and time. As a social entrepreneur, I'm working to help level the playing field.
Giving Map
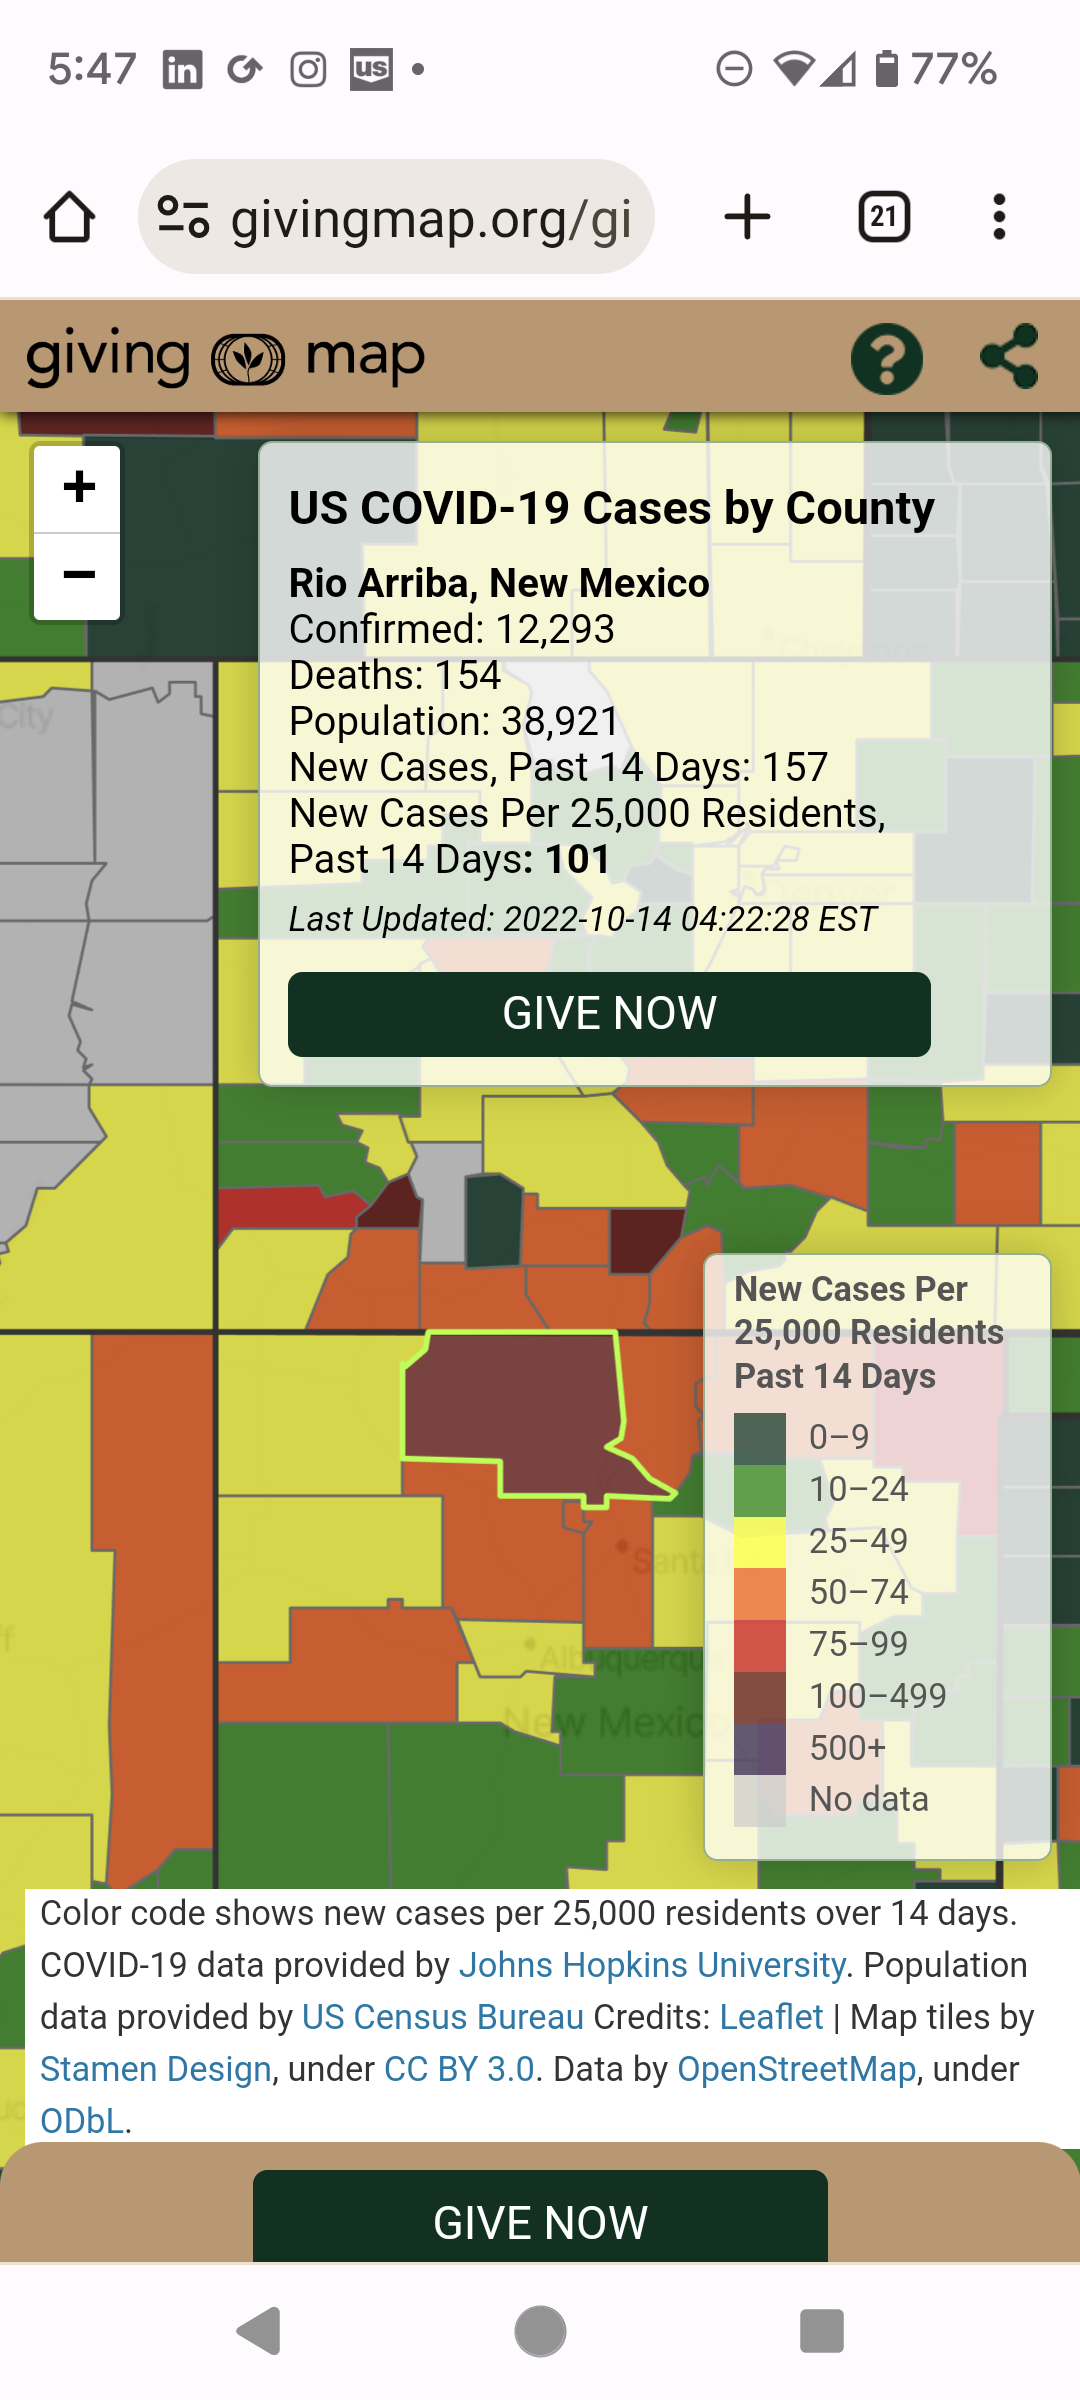
The Giving Map is a not-for-profit, grant-funded initiative that created a responsive, data-driven COVID-19 relief portal helping grassroots donors give where the need is greatest.
Data Driven Philanthropy
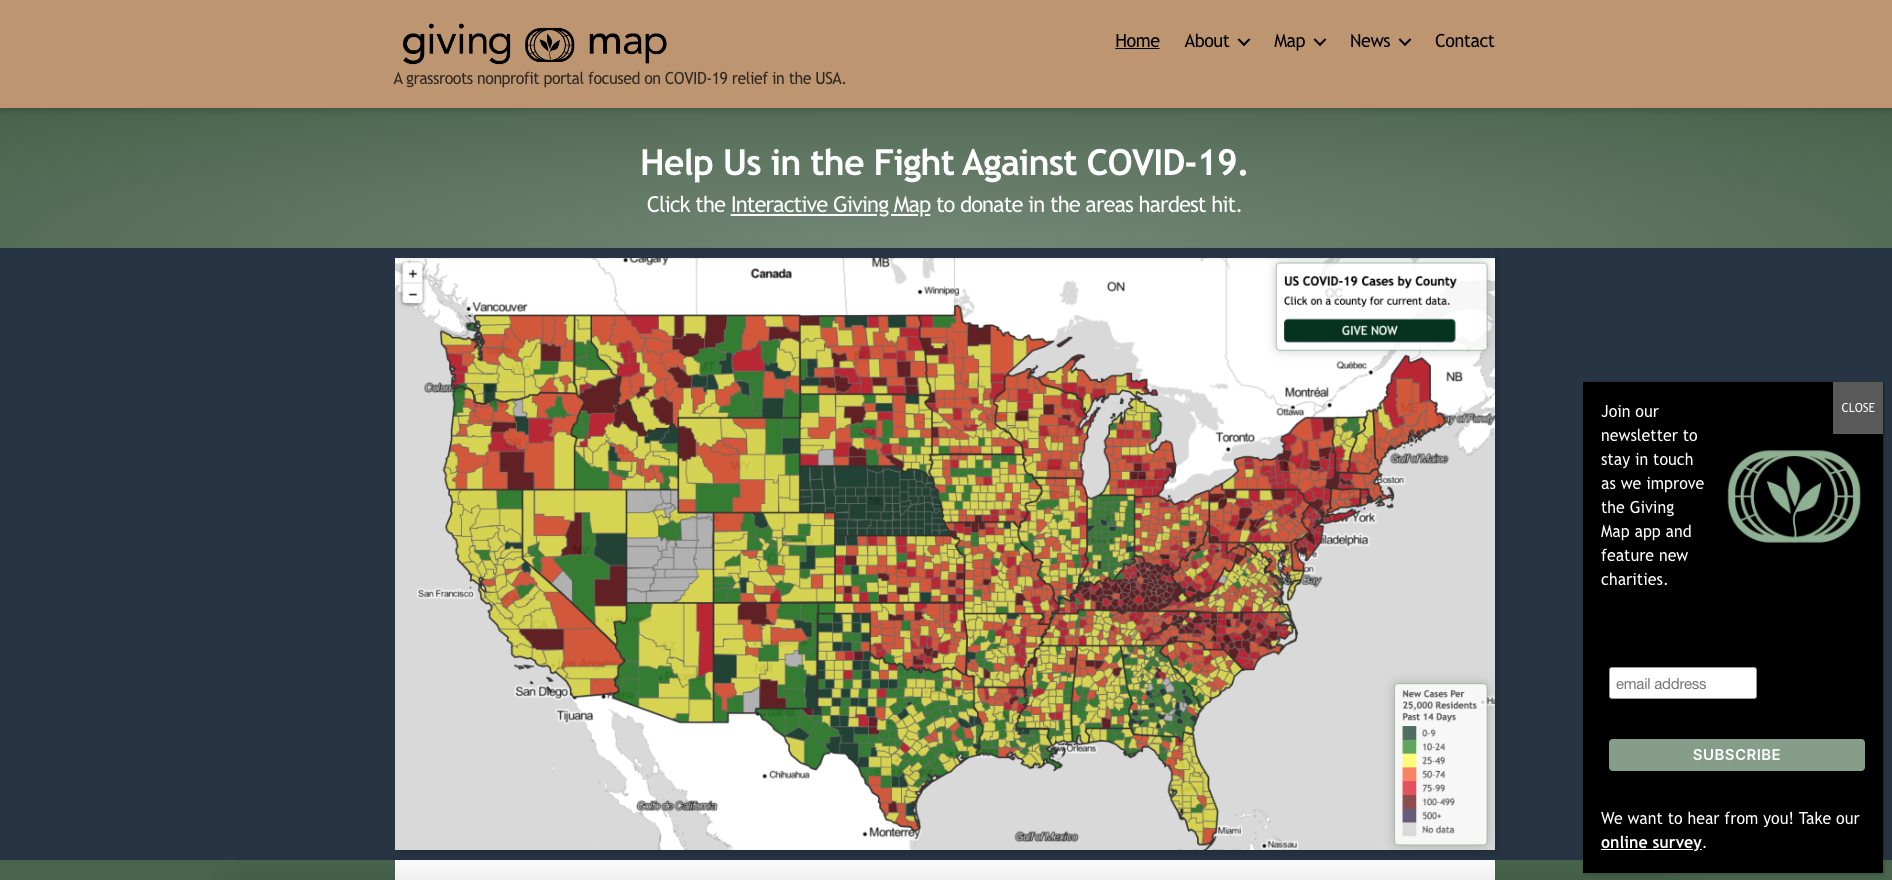
Created in partnership with Charity Navigator and utilizing Leaflet.js open source map libraries, our interactive web application gave visitors a way to reach out and help communities directly during quarantine, while staying informed about the risks from COVID-19. The site drew more than 20,000 visitors in its first three weeks.
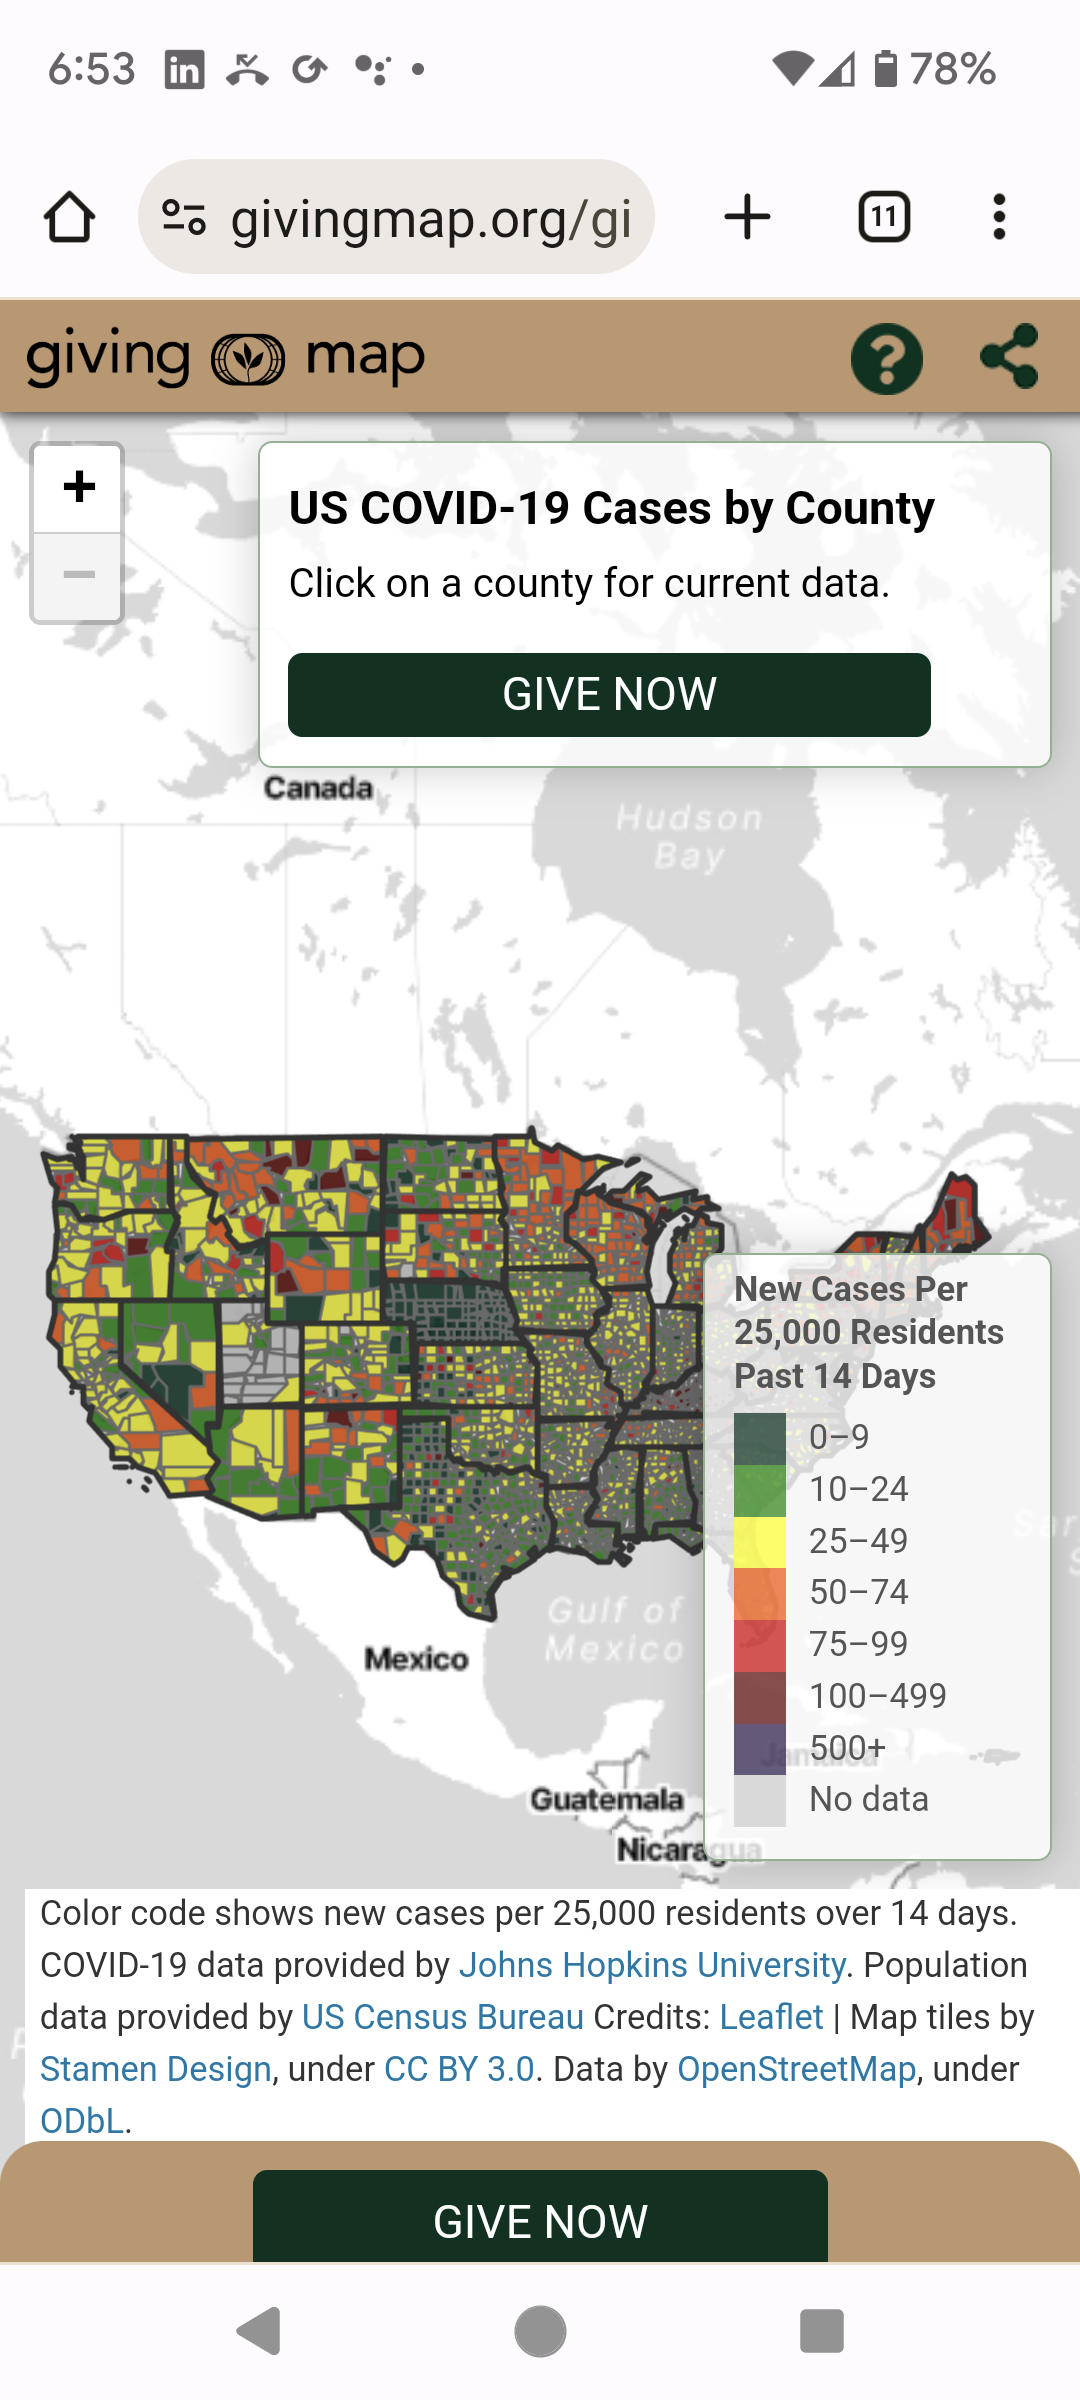
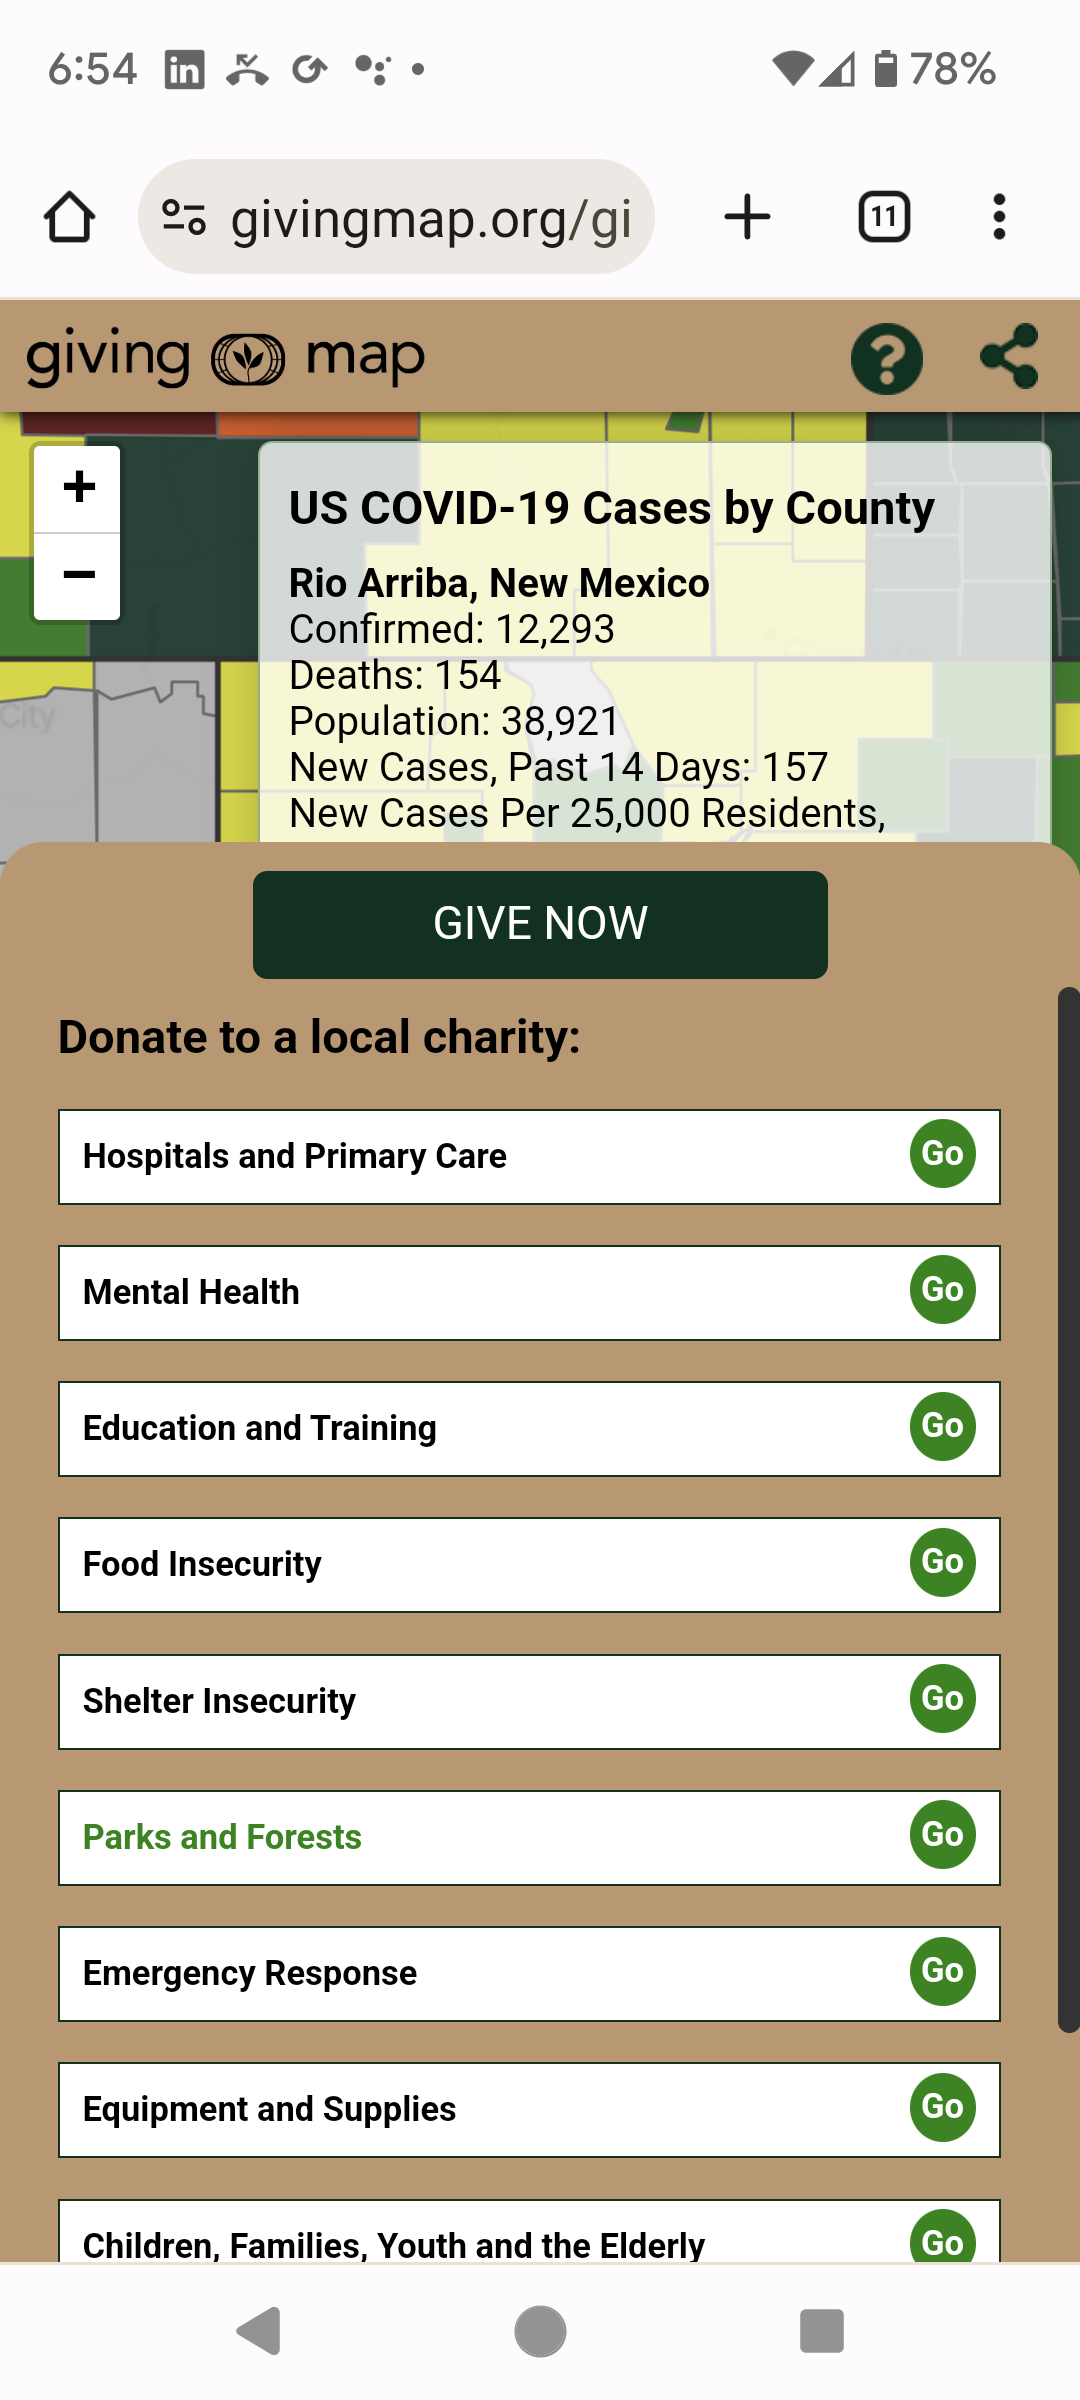
The responsive web application, available for desktop, iOs, and Android, was updated daily with the latest Johns Hopkins data on COVID-19 infection rates across the United States. Thanks to our custom-developed API, users were able to click on counties and view case data, while making a donation to charity in any of ten giving categories.
The open-source project attracted volunteers across ages and skill levels, in addition to paid contract roles. Team members relied on Agile / Scrum and 3X weekly video "stand-ups" to remain in close contact and build a sense of shared purpose and carmaderie.
Our 1.0 app released launched in July 2020, just eight weeks after project kickoff. User surveys and heatmap analytics showed the design was popular and effective for both checking infection rates and making charitable donations. We continued to fine-tune usability for desktop and mobile audiences.
Visit our repo on GitHub.
Read more in The Startup magazine.
Hunger Map
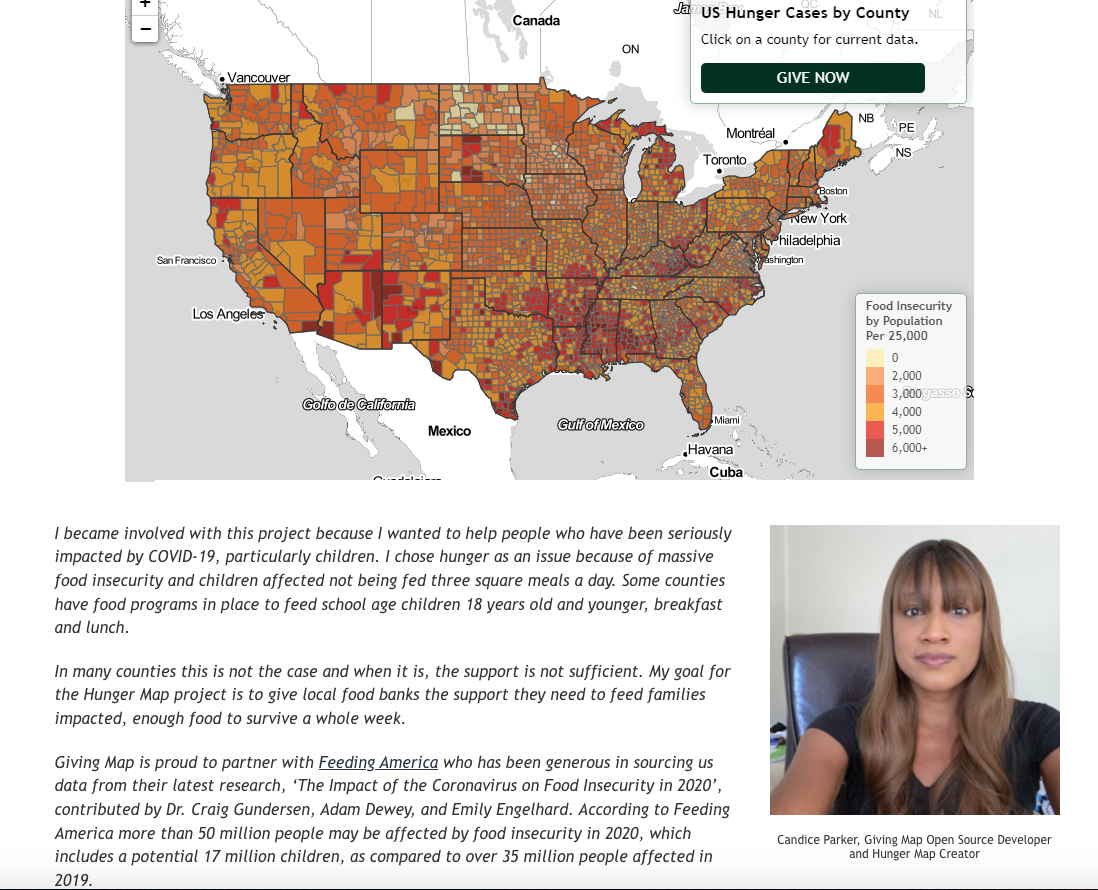
In December 2020, we launched the Hunger Map, a cross-platform responsive web application which gives donors a way to take immediate action on issues of food insecurity across the country. The project drew on a recent dataset from Feeding America and adapted the original open source template for the Giving Map COVID-19 relief project.
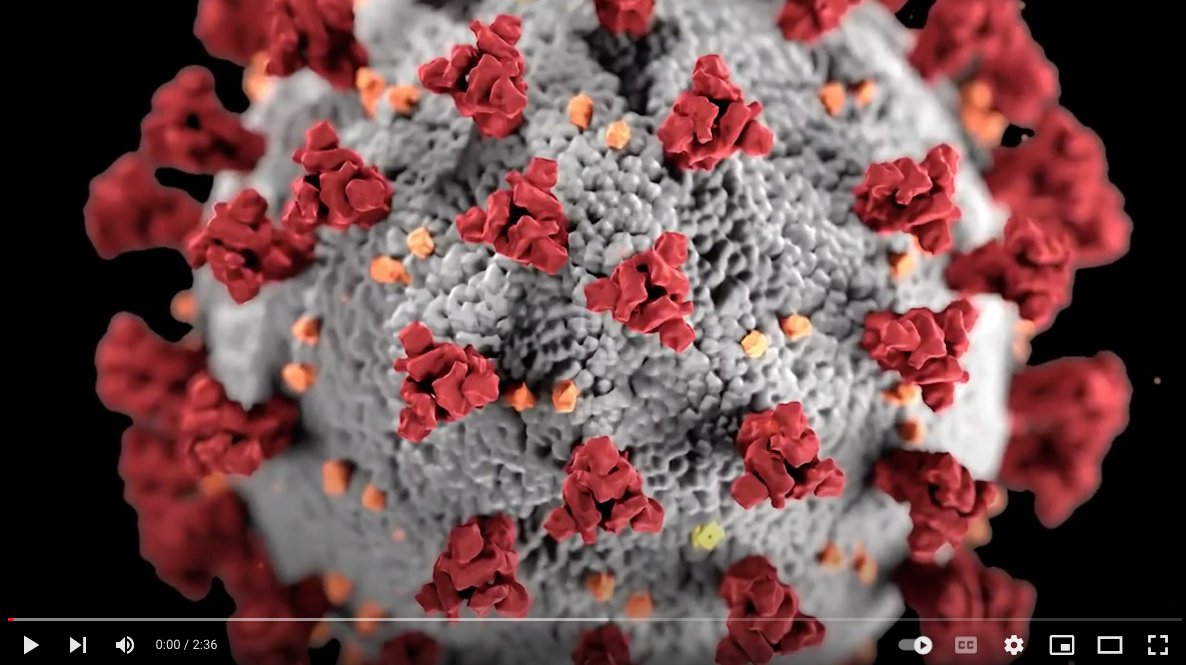
COVID-19 Awareness
Between November 25 (the Wednesday before Thanksgiving) and December 15, 2020, Lotus.fm produced a series of time lapse infographics as Public Service Announcements to accompany the Giving Map web application. These animated 4D data visualizations show cases and deaths from Coronavirus during Fall 2020.
The animated campaign went viral on social media with more than 10,000 shares across Facebook and Twitter, reaching an estimated 6.2 million online viewers.